Categories
- Circuit Board Indicators, Arrays, Light Bars, Bar Graphs(1)


- 1
Description of Circuit Board Indicators, Arrays, Light Bars, Bar Graphs
Circuit board indicators, arrays, light bars, and bar graphs are electronic display devices commonly used to offer visual feedback or to signify the operational status of electronic devices. These devices incorporate LED or LCD elements that can exhibit a variety of colors and patterns to convey the system's health, warnings, error messages, or performance metrics.
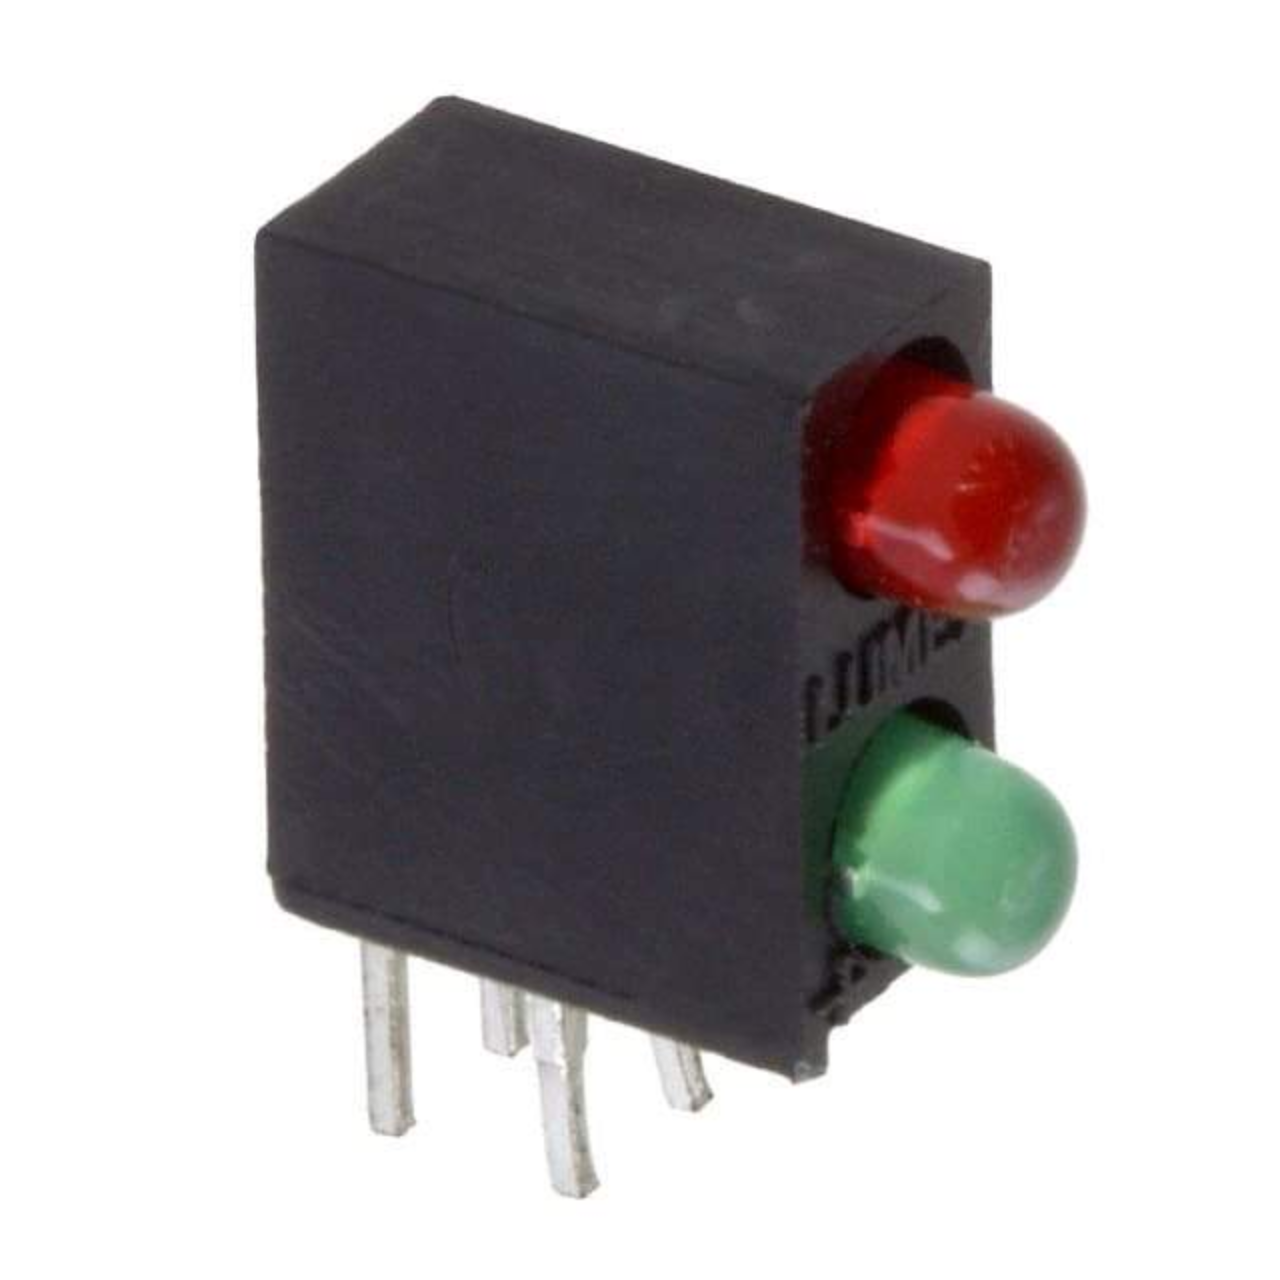
Circuit board indicators might be comprised of single or multiple LED lights.
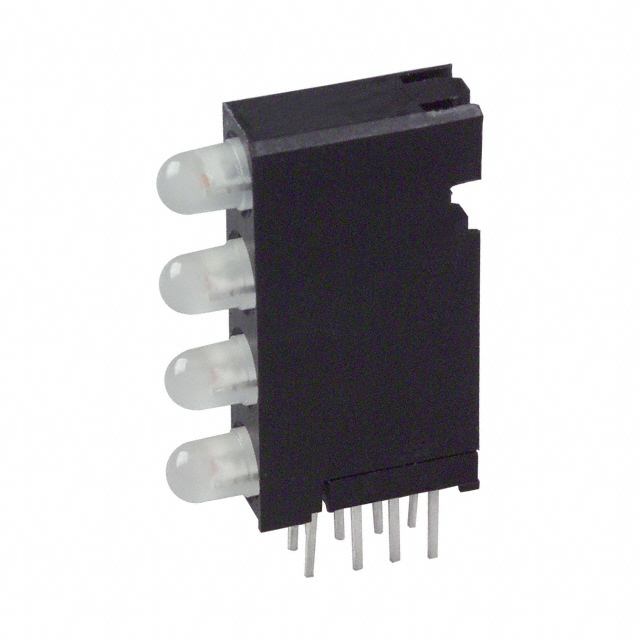
Arrays, light bars, and bar graphs are made up of an array of LEDs that form a continuous display unit, capable of presenting more intricate information or graphics.
Circuit Board Indicators, Arrays, Light Bars, Bar Graphs
Applications of Circuit Board Indicators, Arrays, Light Bars, Bar Graphs
Circuit board indicators, arrays, light bars, and bar graphs serve as visual cues in the realm of electronics, designed to display data or offer feedback. These components are used to signal system status, warn users of potential issues, visually represent data, or provide operational feedback on devices. They are widely used in industrial control panels, audio equipment, and instrumentation.
Working Principle of Circuit Board Indicators, Arrays, Light Bars, Bar Graphs
- Circuit Board Indicators: These are typically small light-emitting diodes (LEDs) or other types of indicators that display a single status or piece of information. They are straightforward components that signal a specific condition or data point on a device.
- Arrays: Arrays extend the functionality of individual indicators by grouping multiple circuit board indicators together. This setup allows for the display of more complex information than what a single indicator could provide.
- Light Bars: Similar to arrays, light bars consist of several rows of indicators. They are designed to handle the display of large amounts of information, making them suitable for applications that require extensive data representation.
- Bar Graphs: Composed of multiple bars, each representing a certain value, bar graphs are used to display complex information in a visual, comparative format. They are particularly useful for showing data that needs to be compared or analyzed in terms of relative values.